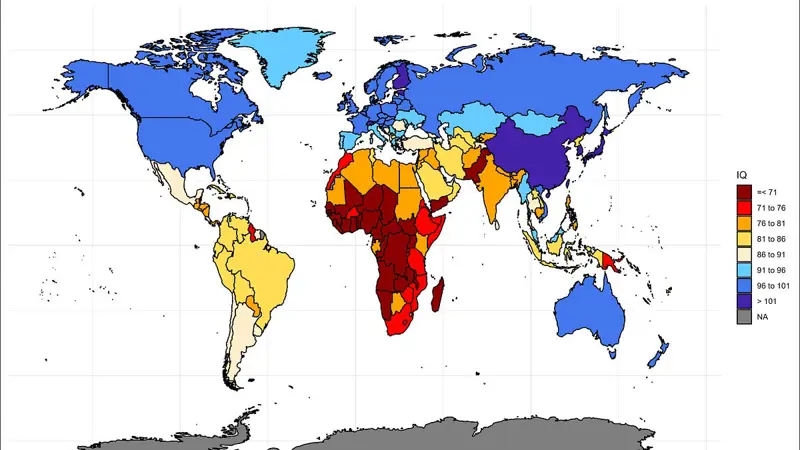
Reference group white Britons IQ 100. Sub-Saharan Africa IQ 70 reflective of cognitive test ability, closer to 75 controlling for education. World IQ 85.8 weighted by population. China IQ 101 inflated by urban oversampling, true 95-100. Biased data collection plays almost no role in country differences. IQ correlates with scholastic tests like PISA and TIMSS. Little evidence IQ tests regionally biased. Education boosts test scores without raising general intelligence. Differences between countries slightly inflated. Half data from representative international assessments. IQ predicts GDP per capita. North Korea IQ low 90s deflated by refugee sampling. Myanmar IQ mid-80s. Kazakhstan IQ upper 80s. Standard errors improved 41% over prior dataset. Samples adjusted for selectivity, location, age.
Comments
Be the first to comment!