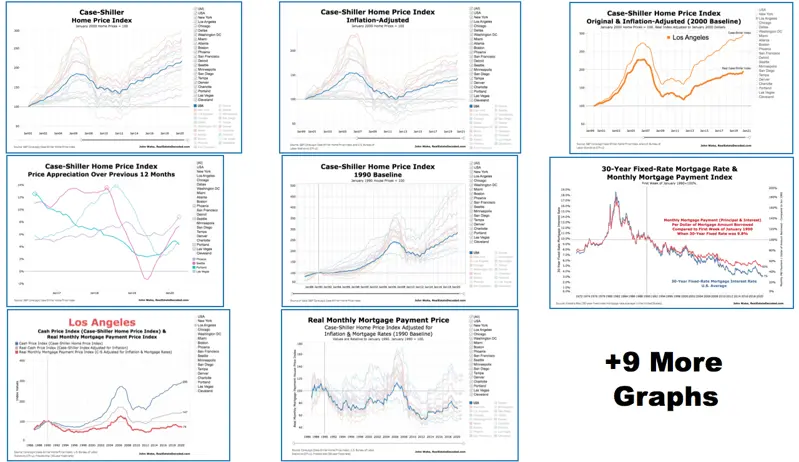
Case-Shiller measures repeated sales of same single-family houses. Index sets January 2000 at 100 so 200 means prices doubled. Data covers 16 of top 20 US metros plus others. Index lags 2-3 months using 3-month moving averages. Inflation-adjusted with CPI-U less shelter. Baseline shifted to 1990 reveals full bubble cycles. Booms began 1997-1999 per Ferreira and Gyourko study. 1990 recession delayed recovery to prior prices. New York and Boston peaked late 1980s. California and DC peaked before S&L recession. Denver and Portland surged in 1990s. Real mortgage payment index factors interest rates. Assumes 75% of payment is principal and interest. Down payments and taxes dilute rate impact on payments. Case-Shiller outperforms average or median prices. Value-weighted so expensive houses weigh more. Switched to CPI less shelter deflator in 2021.
Comments
Be the first to comment!